1. Which of the following is NOT a part of continuum of natural history of the disease?
a) Stage of Susceptibility
b) Stage of preclinical
c) Stage of prevention
d) Stage of recovery
2. Which of the following is also known as retrospective studies?
a) Cohort studies
b) Descriptive studies
c) Experimental studies
d) Case control studies
3. Total number of deaths reported during a given time interval from estimated mid-interval population is called;
a) death rate
b) Crude death rate
c) mortality rate
d) proportional mortality
4. Number of live births reported during a given time interval from estimated mid-interval population is called;
a) Birth Rate
b) Growth Rate
c) Crude Fertility rate
d) Crude Birth Rate
5. Number of live births reported during a given time interval from estimated number of women age 15 to 44 years mid interval is known as;
a) Crude Fertility Rate
b) Birth Rate
c) Growth Rate
d) Sex ratio
6. Number of current cases(new and old) of specified disease identified over a given time interval from estimated population at mid interval is called;
a) Prevalence
b) Period Prevalence
c) Point Prevalence
d) Disease Prevalence
7. Use of statistics to analyze characteristics or changes to a population is termed as;
a) population Pyramid
b) vital statistics
c) Population statistics
d) Population dynamics
8. Which of the following term provides true representation of whole population?
a) Sampling
b) Random Sampling
c) Case reporting
d) Sample
9. Measure of the frequency of occurrence of death in a defined population during a specified interval is called;
a) Crude death rate
b) Mortality Rate
c) Death ratio
d) Mortality
10. Public health surveillance DOES NOT consists on the following step;
a) Systematic collection
b) Analysis
c) Planning
d) Interpretation
11. Surveillance system information cycles include;
a) Family and community
b) Public, Health care provider and Health agencies
c) None of the above
d) Public, Health care provider only
12. Epidemiology can be defined as follow EXCEPT;
a) Distribution of health related states
b) Community leaders and their family crises
c) Determinant of health related events
d) Apply to the control of health problems
13. A state of disorder that results from communication ONLY by direct contact is termed as;
a) Infectious disease
b) Contamination
c) Epidemic
d) Contagious disease
14. Which of the following is NOT a basic measurement in epidemiology;
a) Rate
b) Nominator
c) Ratio
d) Proportion
15. Which of the following is usually expressed as percentage;
a) Rate
b) Nominator
c) Ratio
d) Proportion
16. Measurement of disease, disability or death and converting this information in to rates and ratio is defined as;
a) Specificity
b) Screening
c) Frequency
d) Sensitivity
17. Measurement of current status of disease is termed as;
a) Prevalence
b) Incidence
c) Cumulative Incidence
d) Mid interval population
18. A person who harbors the microorganisms of a disease and excretes them without self suffering from symptoms is called;
a) Reservoir
b) Carrier
c) Host
d) Agent
19. The modes of transmission of infectious diseases are as follow EXCEPT;
a) Direct
b) Indirect
c) Physiological
d) Biological
20. The number of new cases occurring in a defined population during a specified period of time is called;
a) Prevalence
b) Incidence
c) a and b
d) Cumulative incidence
21. Epidemiological methods can be categorized as follow;
a) Descriptive, cohort and case control
b) Descriptive, cross sectional and experimental
c) Descriptive, prospective and experimental
d) Descriptive, Analytical and experimental
22. In descriptive epidemiology disease described in terms of;
a) What, Why and How
b) Host, Agent and Environment
c) Time, Place and Person
d) Agent, Place and Person
23. Which of the following is also known as prospective study;
a) Cohort studies
b) Descriptive studies
c) Experimental studies
d) Case control studies
24. In epidemiological triad environmental factors can be classified as;
a) Physical
b) Chemical
c) Social
d) Biological
25. Which of the following ratio provide us an estimate of risk in case control study;
a) Odd ratio
b) Sex ratio
c) Disease ratio
d) Dependency ratio
26. The entire group of people or elements that have at least one thing is common is known as;
a) Sample
b) Parameter
c) Hypothesis
d) Population
27. Sampling done on the basis of some pre determined ideas and its result can not be generalized is defined as follow;
a) Snow ball sampling
b) Purposive sampling
c) Probability sampling
d) Non-probability sampling
28. Tertiary prevention includes;
a) Disability limitation
b) Prompt treatment
c) Rehabilitation
d) a and c
e) a and b
29. Agents such as vitamins, protein, fat etc. are an examples of;
a) Physical Agents
b) Nutritive Agents
c) Chemical Agents
d) All of the above
30. Which of the following are key components of Epidemiological triangle,
a) Host, Agent and Physical Environment
b) Host, Genes and Physical Environment
c) Host, Agent and Environment
d) None of the above
31. Tertiary prevention Does not includes;
a) Disability limitation
b) Prompt treatment
c) Rehabilitation
d) a and c
32. Agents such as vitamins, protein, fat etc. are an examples of;
a) Physical Agents
b) Nutritive Agents
c) Chemical Agents
d) All of the above
33. Which of the following are not key components of Epidemiological triangle,
a) Host and Agent
b) Host and Environment
c) Host, Agent and Environment
d) Time, Place and Person
34. Which of the following is a part of continuum of natural history of the disease?
a) Stage of health promotion
b) Stage of prevention
c) Stage of Recovery
d) Stage of sampling
35. Which of the following are also known as retrospective studies?
a) Cohort studies
b) Descriptive studies
c) Experimental studies
d) Case control studies
36. A person who harbors the microorganisms of a disease and excretes them without self suffering from symptoms is called;
a) Reservoir
b) Carrier
c) Host
d) Agent
37. The modes of transmission of infectious diseases are as follow EXCEPT;
a) Direct
b) Indirect
c) Physiological
d) Biological
38. Total number of deaths reported during a given time interval from estimated mid-interval population is called;
a) death rate
b) Crude death rate
c) mortality rate
d) proportional mortality
39. Number of live births reported during a given time interval from estimated mid-interval population is called;
a) Birth Rate
b) Growth Rate
c) Crude Fertility rate
d) Crude Birth Rate
40. Number of live births reported during a given time interval from estimated number of women age 15 to 44 years mid interval is known as;
a) Crude Fertility Rate
b) Birth Rate
c) Growth Rate
d) Sex ratio
41. Number of current cases(new and old) of specified disease identified over a given time interval from estimated population at mid interval is called;
a) Prevalence
b) Period Prevalence
c) Point Prevalence
d) Disease Prevalence
42. Use of statistics to analyze characteristics or changes to a population is termed as;
a) population Pyramid
b) vital statistics
c) Population statistics
d) Population dynamics
43. Measure of the frequency of occurrence of death in a defined population during a specified interval is called;
a) Crude death rate
b) Mortality Rate
c) Death ratio
d) Mortality
44. Public health surveillance DOES NOT consists on the following step;
a) Systematic collection
b) Analysis
c) Planning
d) Interpretation
45. Surveillance system information cycles include;
a) Family and community
b) Public, Health care provider and Health agencies
c) None of the above
d) Public, Health care provider only
46. A state of disorder that results from communication ONLY by direct contact is termed as;
a) Infectious disease
b) Contamination
c) Epidemic
d) Contagious disease
47. Which of the following is NOT a basic measurement in epidemiology;
a) Rate
b) Nominator
c) Ratio
d) Proportion
48. Measurement of current status of disease is termed as;
a) Prevalence
b) Incidence
c) Cumulative Incidence
d) Mid interval population
49. The number of new cases occurring in a defined population during a specified period of time is called;
a) Prevalence
b) Incidence
c) a and b
d) Cumulative incidence
50. Which of the following is also known as prospective study;
a) Cohort studies
b) Descriptive studies
c) Experimental studies
d) Case control studies
51. Which of the following ratio provide us an estimate of risk in case control study;
a) Odd ratio
b) Sex ratio
c) Disease ratio
d) Dependency ratio
52. The entire group of people or elements that have at least one thing is common is known as;
a) Sample
b) Parameter
c) Hypothesis
d) Population
53. Sampling done on the basis of some pre determined ideas and its result can not be generalized is defined as follow;
a) Snow ball sampling
b) Purposive sampling
c) Probability sampling
d) Non-probability sampling
54. Graphical illustration that shows the distribution of various age groups in population is known as;
a) Dependency Ratio
b) Age Ratio
c) Population Pyramid
d) Population Dynamics
55. Ratio of population who are economically not active to those who are economically active can be defined as;
a) Dependency Ratio
b) Age Ratio
c) Population Ratio
d) Risk benefit ratio
56. In which of the following sampling there is a minimum chance of bias and equally chances of being selected for study.
a) Accidental Sampling
b) Simple Random Sampling
c) Purposive Sampling
d) Snow ball Sampling
57. In study if we are selecting every seventh subject it comes under which of the following sampling method?
a) Stratified Sampling
b) Quota Sampling
c) Systematic Sampling
d) Purposive Sampling
58. Systematic errors produced by your sampling procedure is known as;
a) Sampling bias
b) Sampling errors
c) Non sampling errors
d) Random error
59. The profile of single patient is reported in detail by one or more clinicians is called as follow;
a) Case control study
b) Case Series
c) Investigation
d) Case Report
60. In which of the following study we compare one group among whom the problem is present and another group where problem is absent?
a) Case control study
b) Case Series
c) Cohort study
d) Case Report
Answer key:
1. C
2. D
3. B
4. D
5. A
6. B
7. C
8. D
9. B
10. C
11. B
12. B
13. D
14. B
15. D
16. C
17. A
18. B
19. C
20. B
21. D
22. C
23. A
24. B
25. A
26. D
27. B
28. D
29. B
30. C
31. B
32. B
33. D
34. C
35. D
36. B
37. C
38. B
39. D
40. A
41. B
42. C
43. B
44. C
45. B
46. D
47. B
48. A
49. B
50. A
51. A
52. D
53. B
54. C
55. A
56. B
57. C
58. A
59. D
60. A

 Mean Deviation:
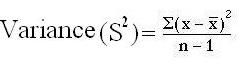
 Formula
OR S2 =
Calculating variance: Heart rate of certain patient is 80, 84, 80, 72, 76, 88, 84, 80, 78, & 78. Calculate variance for this data.
Solution:
Step 1:
Find mean of this data
Formula
OR S2 =
Calculating variance: Heart rate of certain patient is 80, 84, 80, 72, 76, 88, 84, 80, 78, & 78. Calculate variance for this data.
Solution:
Step 1:
Find mean of this data
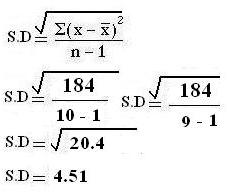
 Variance = 184/ 10-1 = 184/9
Variance = 20.44
Standard Deviation
Variance = 184/ 10-1 = 184/9
Variance = 20.44
Standard Deviation
 Formula:
OR S =
Calculating Standard Deviation (we use same example): Heart rate of certain patient is 80, 84, 80, 72, 76, 88, 84, 80, 78, & 78. Calculate standard deviation for this data.
SOLUTION:
Step 1: Find mean of this data
Formula:
OR S =
Calculating Standard Deviation (we use same example): Heart rate of certain patient is 80, 84, 80, 72, 76, 88, 84, 80, 78, & 78. Calculate standard deviation for this data.
SOLUTION:
Step 1: Find mean of this data
 MERITS AND DEMERITS OF STD. DEVIATION
 is close to zero.
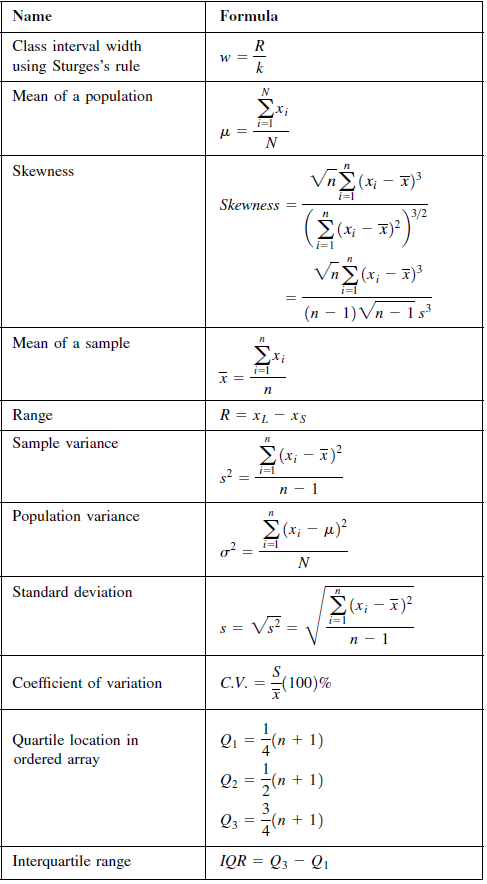 Symbol Key:
